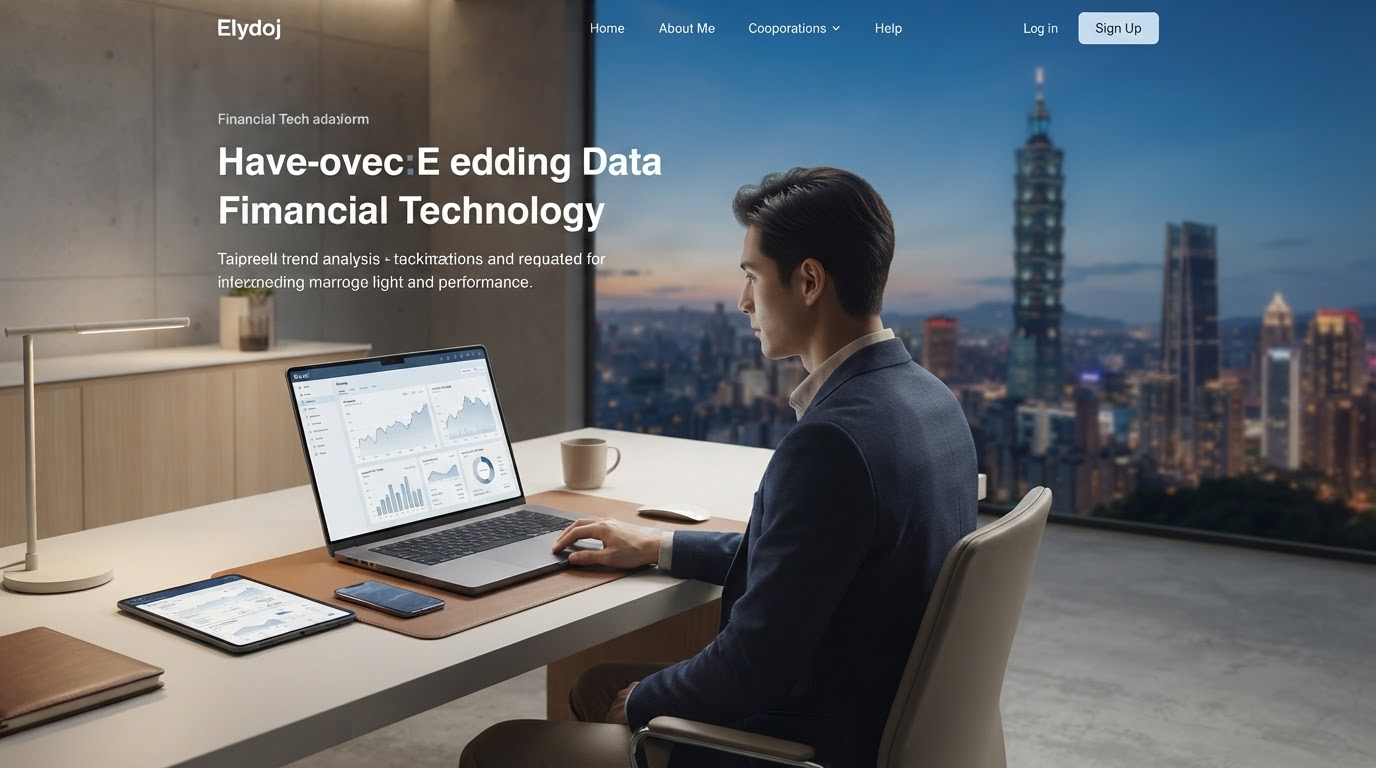
Stock Maximum Pro AI decision analysis dashboard situation diagram

Use artificial intelligence to optimize decision-making and integrate cross-exchange big data

Stock Maximum Pro unifies market data scattered across multiple exchanges and uses data-oriented analysis models to help families make more risk-aware strategic optimizations in long-term asset allocation.

A single dashboard simultaneously displays position distribution, risk indicators and trend signals, reducing the time cost of repeated comparisons between multiple platforms.

Start smart analysis now

Stock Maximum Pro team analyzes multi-exchange data situation diagram
complexity

Data scattered across multiple exchanges is slowing down your judgment

  • Different exchanges have different market conditions, trading volumes, and fee rate rules. Checking them one by one is time-consuming and easy to make mistakes.
  • Manually compiled reports cannot reflect market changes in a timely manner, and decisions often lag behind market trends.
  • Lacking a unified risk perspective, it is difficult to judge whether the overall asset allocation is over-concentrated.

Stock Maximum Pro integrates data from multiple exchanges into a single dashboard as the only reference source for decision-making, reducing the cognitive burden of information comparison and presenting potential risks with quantitative indicators.

core competencies

An analytics engine powered by massive amounts of historical and real-time data

The system continuously processes cross-market data, finds patterns that are difficult to identify within a limited time through manual analysis, and transforms the results into executable reference evidence.

Predictive analytics

Trend and Volatility Forecasting Model

Based on historical prices, trading volume and market structure characteristics, the model estimates the probability of short- and medium-term trend continuation or reversal, which serves as the input basis for strategy optimization.

Risk management and control

Risk management and control engine

Real-time monitoring of position concentration, volatility and correlation changes, and when risk indicators exceed the set threshold, a reminder is displayed on the dashboard.

Instant insights

Instant market insights

Integrate quotations and transaction data from multiple exchanges, and update analysis results as soon as possible when there are abnormal price fluctuations to avoid information delays affecting judgment.

unified perspective

Unified dashboard

Integrate cross-platform asset, profit and loss and risk data into a single screen, replacing the manual switching of multiple exchange backends.

How it works

Three stages from data to decision support

The system design follows a clear and verifiable process so that every recommendation can be traced back to the original data and analysis logic.

01

data collection

Continuously capture real-time quotations, transaction records and historical data from multiple exchanges, and clean and standardize them to ensure the consistency of subsequent analysis.

02

AI modeling and computing

The model performs feature extraction and pattern recognition on a large amount of data, and continues to verify and adjust parameters with new data to gradually improve the stability of predictions.

03

decision support output

The analysis results are converted into specific risk indicators and strategic recommendations, which are presented on the dashboard for users to use as a reference for final decision-making.

Application scenario

Two common scenarios to support families’ long-term financial security

The following scenario illustrates how the platform can assist different investment objectives with objective data rather than providing a single standard answer.

Situation one

Long-term asset accumulation planning

For families aiming for retirement or children's education, the platform continuously tracks the long-term trends and fluctuation characteristics of cross-market assets to help evaluate whether the current allocation meets the expected risk tolerance range, rather than just focusing on short-term price fluctuations.

Long-term Trend and Risk Tracking Panel
Scenario 2

Portfolio diversification across markets

When assets are distributed across multiple exchanges and asset classes, the unified dashboard can present the overall concentration and correlation, help determine whether the allocation ratio needs to be adjusted, and reduce the impact of violent fluctuations in a single market on the overall assets.

Cross-asset correlation analysis view
FAQ

About data security and model reliability

The following explains the basic principles of the platform in data processing and model use. If you have further questions, please feel free to ask through the contact page.

How will my account and transaction data be protected?

All linked exchange data are encrypted during transmission and storage, and are only used for analysis and dashboard presentation, and will not be used for purposes unrelated to analysis purposes.

What exchanges and asset types does the platform support?

Currently, it supports the integration of market data from mainstream exchanges, covering common categories such as stocks and crypto assets. The specific supported list will be continuously updated with the progress of technical integration. It is recommended to contact us to confirm the latest status.

How is the accuracy of AI predictions evaluated?

Forecasting models do not provide absolute answers, but present reference results in the form of probabilities and trend intervals. The model will continue to be iteratively verified with new data, but there are uncertainties in the market itself, and any analysis results should be used in conjunction with your own risk judgment.

Inject AI power into your home asset allocation

Integrate scattered market data into a consistent basis for decision-making, allowing long-term asset planning to be based on traceable analytical logic rather than temporary judgments based on fragments of information.